Overview offers a visual representation of your progress toward your degree. This button is located next to the What-If Report button on the dashboard. The Overview page includes the following graphs/tables:
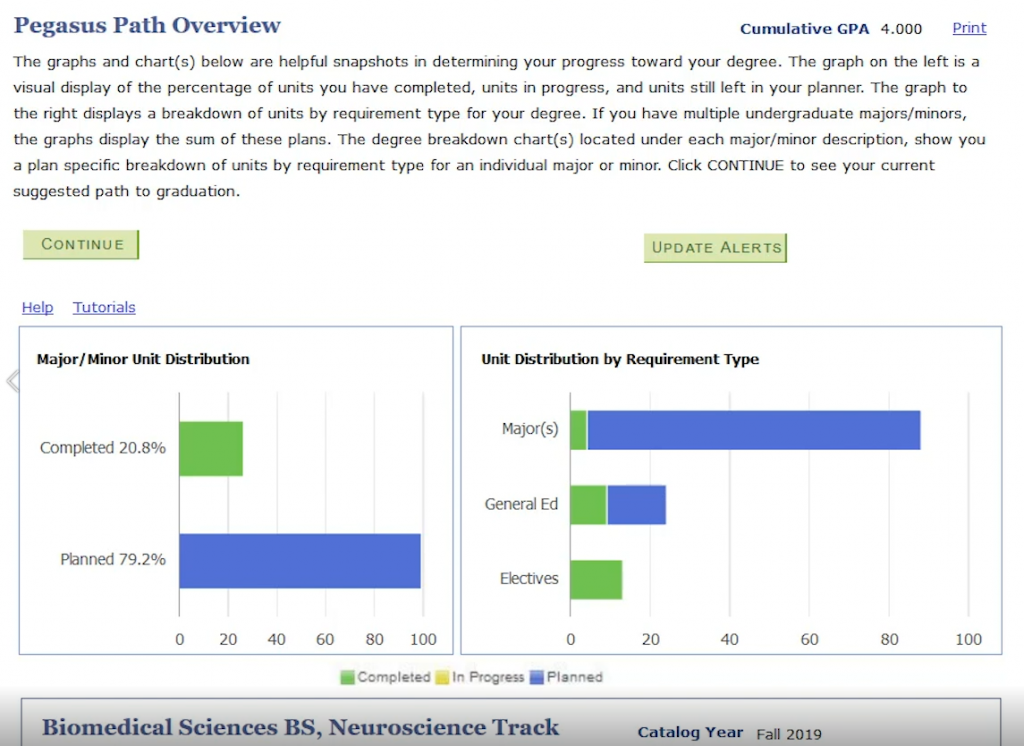
The graph to your left displays your:
- Completed units
- In progress units
- Units remaining
The graph to your right displays a breakdown of your units based on the requirement for your degree type such as:
- Major
- General education
- Electives
Below these two graphs, you’ll see a numerical breakdown of the same information.
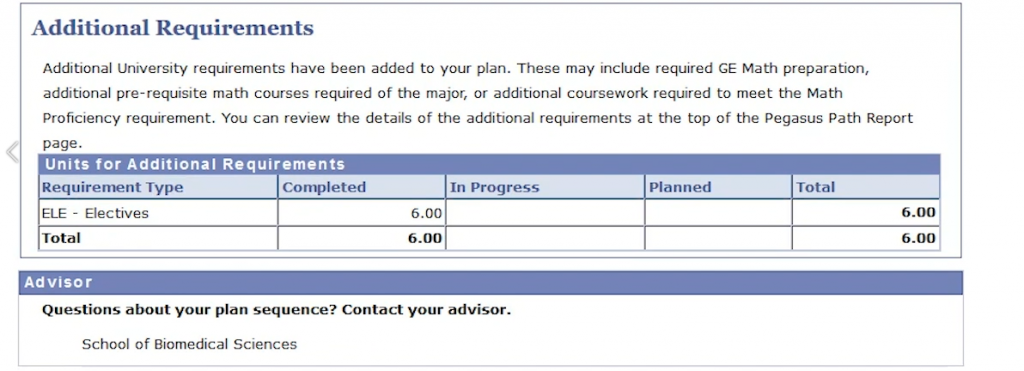
If your degree program includes additional requirements that you must fulfill, you’ll see a table with the related information. For example, your degree program might require an additional pre-requisite math course.
To return to the dashboard, click continue at the bottom of the page.
Related FAQs
Overview offers a visual representation of your progress toward your degree and can be found under More > Overview. This section includes three separate graphs/tables:
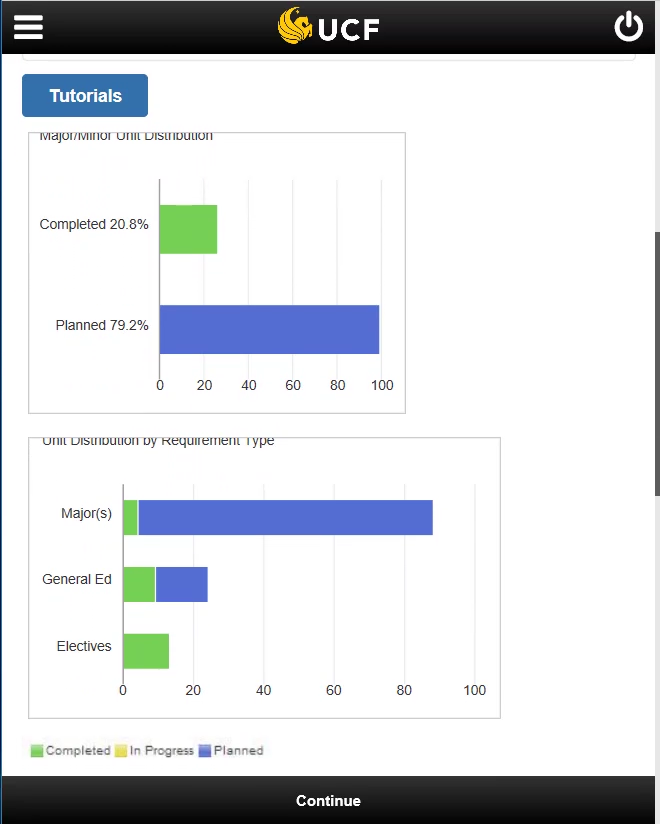
The first graph displays the following:
- Completed units
- In progress units
- Units remaining
The second graph displays a breakdown of your units based on the requirement for your degree type such as:
- Major
- General education
- Electives
Below these two graphs you’ll see a numerical breakdown of the same information.
If your degree program includes additional requirements that you must fulfill, you’ll see a table with the related information. For example, your degree program might require an additional pre-requisite math course.
To return to the dashboard, click continue at the bottom of the page.
Pegasus Path is available via the Student Portal.
On the web, login to myUCF, select Student Self-Service from the left sidebar and navigate to Student Center. Pegasus Path will be listed under the Academics section.
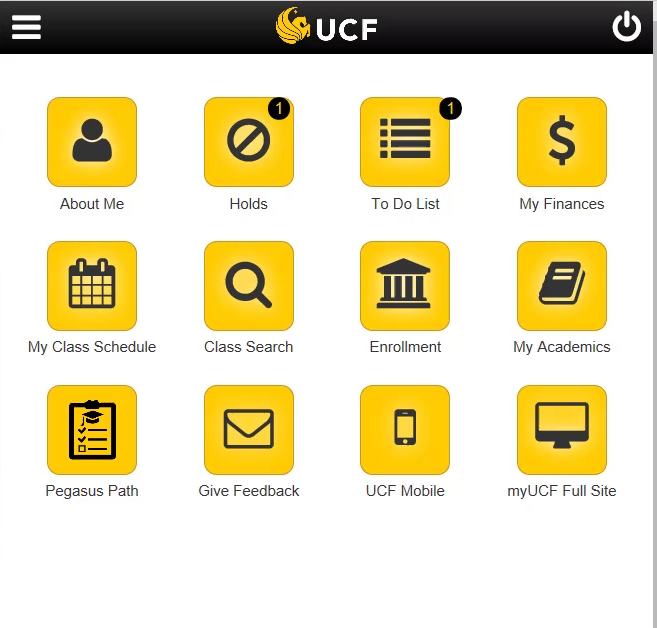
Pegasus Path is accessible from the UCF Mobile app, which is available for Android and iOS devices In the UCF Mobile app, just click on the Pegasus Path icon.
First, make sure that you have the myUCF app installed. This app is available for iOS and Android devices.
Log in to the myUCF app and choose the Pegasus Path icon from the list
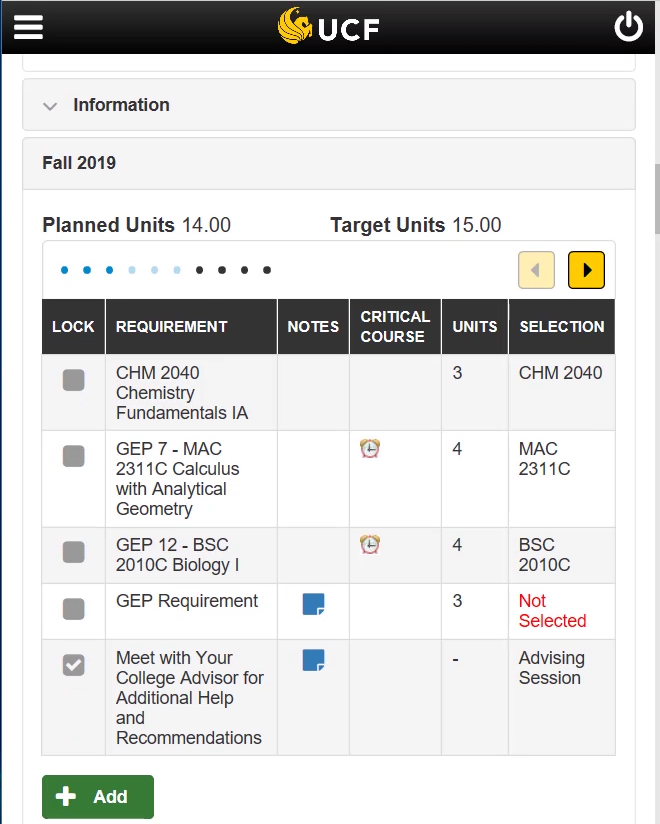
When looking at your plan, you might see “Not Selected” listed in red under the selection column. This means that you can choose a class that you plan on taking to fulfill this part of your degree program.

1. To add a course, click on the select option located to the right of the Selection column. For this example, we’ll choose to add a course that fulfills a General Education Program (GEP) requirement.
2. On the following page, you can choose a class to add to your plan. Selecting from the list of filters on the left will narrow down your search. We’ll add the Communication Found 3 – A3 and State Core Cult/Historical filters.
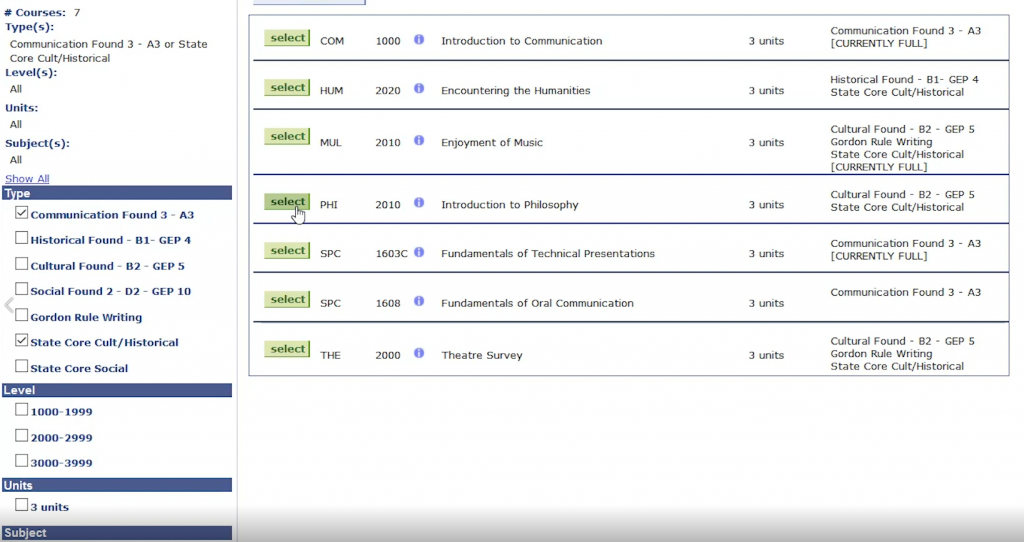
3. You’ll see the list of courses change. Once you find a course you want to take, click on the green select button. We chose PHI 2010, Introduction to Philosophy.
You’ll be taken back to the dashboard. Scroll down to the semester you selected the course for, and you’ll see that it’s been added to your plan.
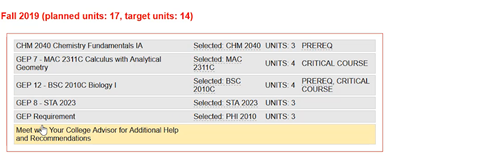
- From the dashboard, scroll down below the Preferences section. If it’s your first time viewing Pegasus Path, these classes have been populated based on the optimal degree plan for your degree program.
- If you see Not Selected for any of your requirements, this means you can choose a course or task.
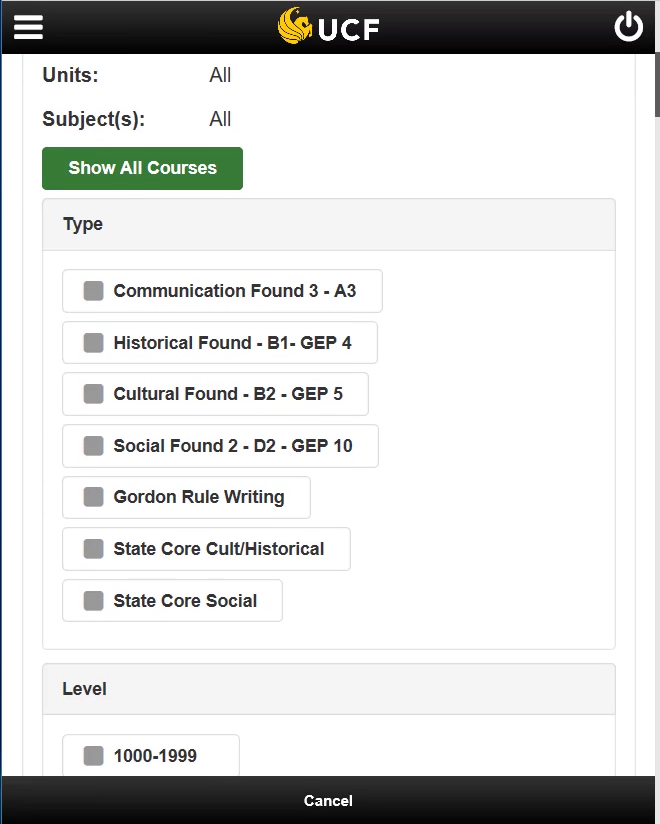
- Click on the gold and black arrows until the Select column appears, then click Select.
- At the top, you can apply filters that help you narrow down your search. Since we chose a GEP requirement to fulfill, we’ll filter for Historical Foundation courses.
- Next, scroll down and select the course you want to add to your plan.
Once you’re back on the dashboard, you can see the course you added to your plan.
The Pegasus Path is an interactive tool that allows you to make changes to your plan by dragging and dropping classes between semesters.
1. Below the Preferences section, click on the Arrange My Plan button.
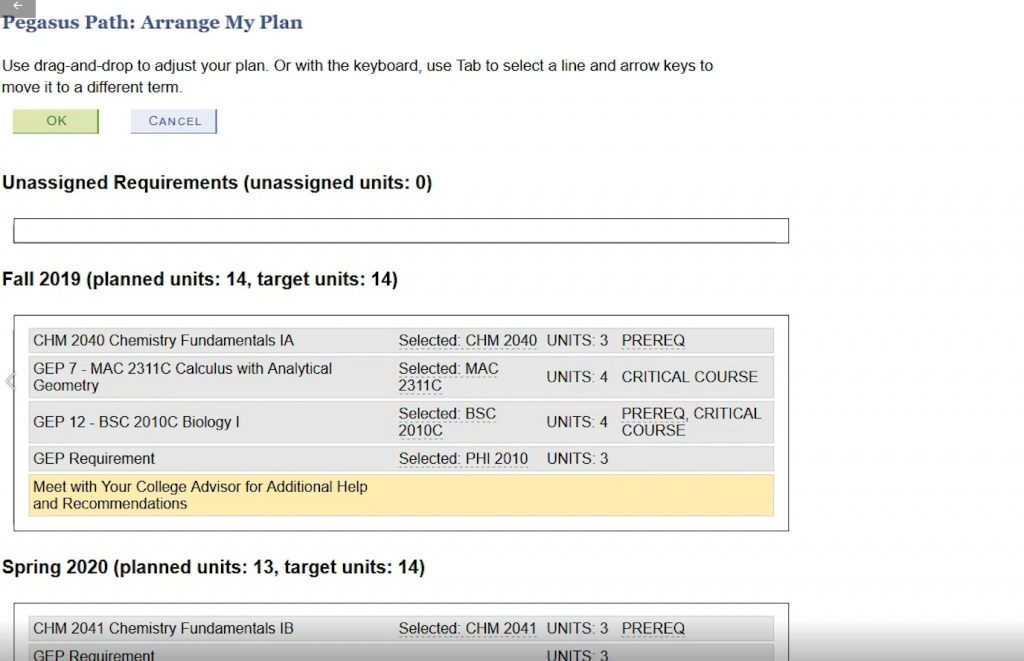
2. To move a planned course from one section to another, simply click and hold down on the course and move your cursor.
3. For our example, we’ll move Statistics to fall 2019 and our Philosophy class to Spring 2020.
Tip: if your semester is highlighted in red after moving a course, this means that you’ve gone over the amount of target units you’ve chosen for that semester. To resolve this, simply move a course from that semester to another semester. Or, you can increase the number of target units in the Preferences section.
4. Pegasus Path will warn you if there are errors when making changes to your plan. Fix these errors before proceeding.
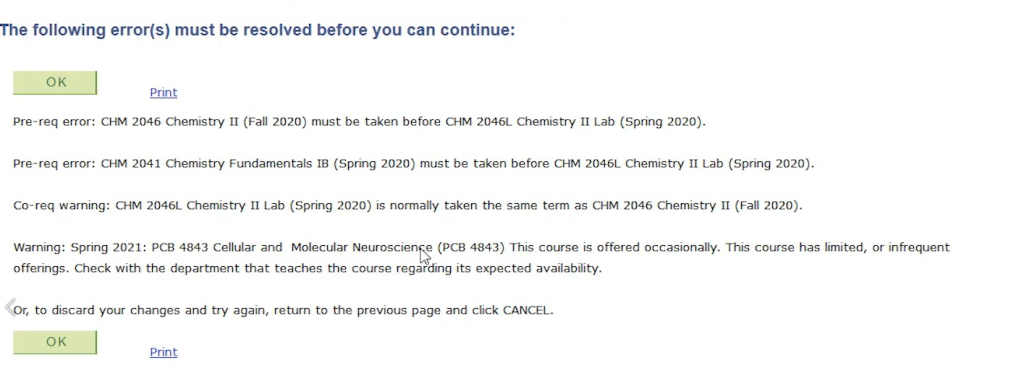
5. Click OK and you’ll be taken back to the Pegasus Path dashboard to view your updated plan.
Important note: Pegasus Path won’t allow you to move courses to a later term if there’s a prerequisite for the course that must be completed in one of the prior semesters first. In some cases, courses must be taken in the same semester, such as for labs.
Next to the myKnight Audit link is the Audit with Planned Courses option, which generates a report that includes the courses you’ve planned in Pegasus Path. This shows you how your planned courses will help you complete your degree.
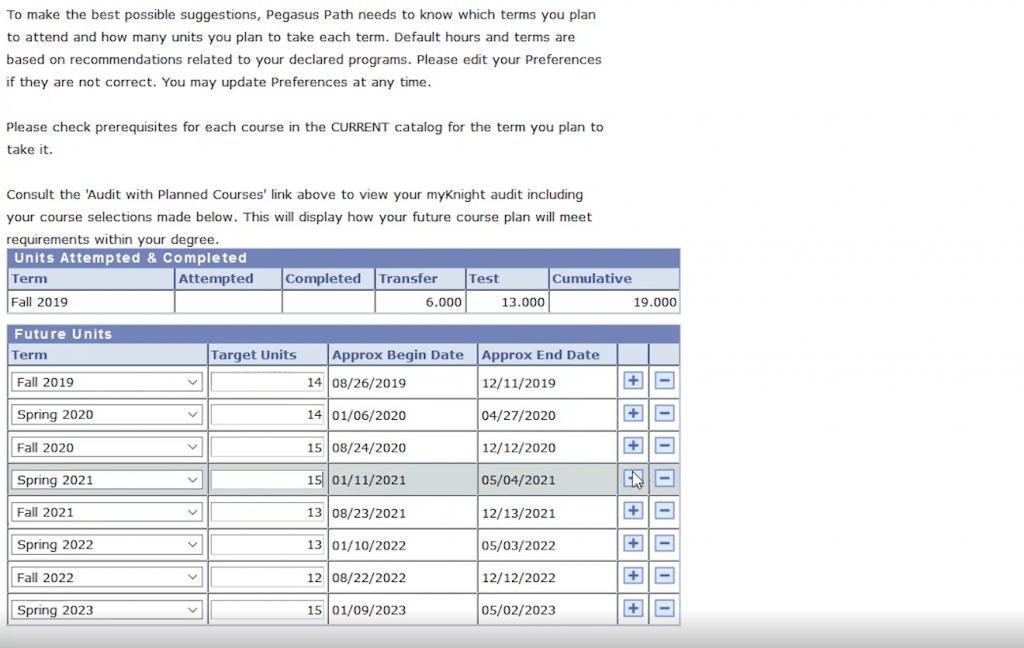
1. Click on the Edit My Terms & Units button on the Pegasus Path dashboard.
2. To change the number of credit hours or units you plan on taking, navigate to the Future Units section and change the number in Target Units column.
3. To add a semester, click on the + button located next to the Approx End Date column.
4. Click on the OK button below the Future Units section.
You’ll be taken back to the dashboard and the Preferences section will be updated to reflects the changes you’ve made to your plan.
- At the top of the dashboard, click on the Edit My Terms & Units button.
- To add a semester, simply click on the Add button. If you’re not planning on attending a certain semester, tap the delete button to remove that semester from your plan.
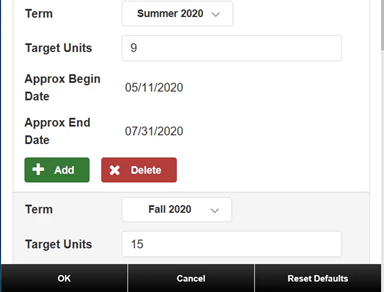
3. Click OK to confirm deletion. Pegasus Path will automatically update your plan to reflect your changes.
This option can be found underneath Refresh Suggestions. When looking at your Pegasus Path plan, you can see a column titled Lock. By checking the boxes in this column, you can lock certain courses or tasks into the semester, so they don’t get moved accidentally.
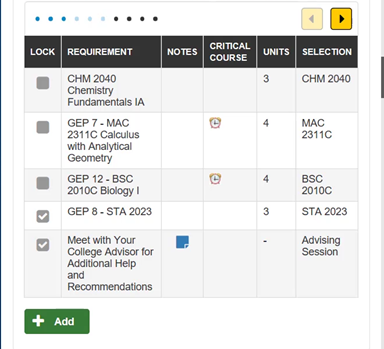
The Clear Locks option allows you to remove all locked courses, meaning you can move those courses again.
The Arrange My Plan function allows you to drag and drop your courses between semesters. The courses and tasks you see in this section are the same ones you see on the Pegasus Path dashboard.
- To access Arrange My Plan, scroll back to the top of the dashboard by clicking on Go to Top and then tap the Arrange My Plan button.
- To move a course from semester to another, hold down on the course and drag it to the desired semester. We moved one of the GEP requirements.
Tip: if your semester title is highlighted in red after moving a course, this means that you’ve gone over the amount of target units you’ve selected for that semester. To resolve this, simply move a course from that semester to another semester. Or, you can increase the number of target units in the Preferences section.
- Pegasus Path will warn you if there are errors when making changes to your plan. Fix these errors before proceeding.
- Click OK and you’ll be taken back to the Pegasus Path dashboard to view your updated plan.
Important note: Pegasus Path won’t allow you to move courses to a later term if there’s a prerequisite for the course that must be completed in one of the prior semesters first. In some cases, courses must be taken in the same semester, such as for labs.
Under the Clear Locks option is Feedback. By clicking on this, you can send us an email with questions and suggestions about Pegasus Path.
Refresh Suggestions
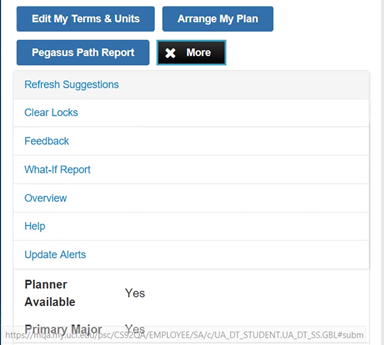
Selecting the More button next to Pegasus Path Report brings up more features within Pegasus Path, such as Refresh Suggestions.
Suggestions from Pegasus Path will be refreshed automatically as you confirm changes to your preferences and plans, but the Refresh Suggestions button lets you do that manually, as well.
Refresh Suggestions
Suggestions from Pegasus Path will be refreshed automatically as you confirm changes to your preferences and plans, but the Refresh Suggestions button, located next to the Overview button, lets you do that manually, as well.
Clear Locks
This button can be found to the right of the Refresh Suggestions button. When looking at your Pegasus Path plan, you can see a column titled Lock.
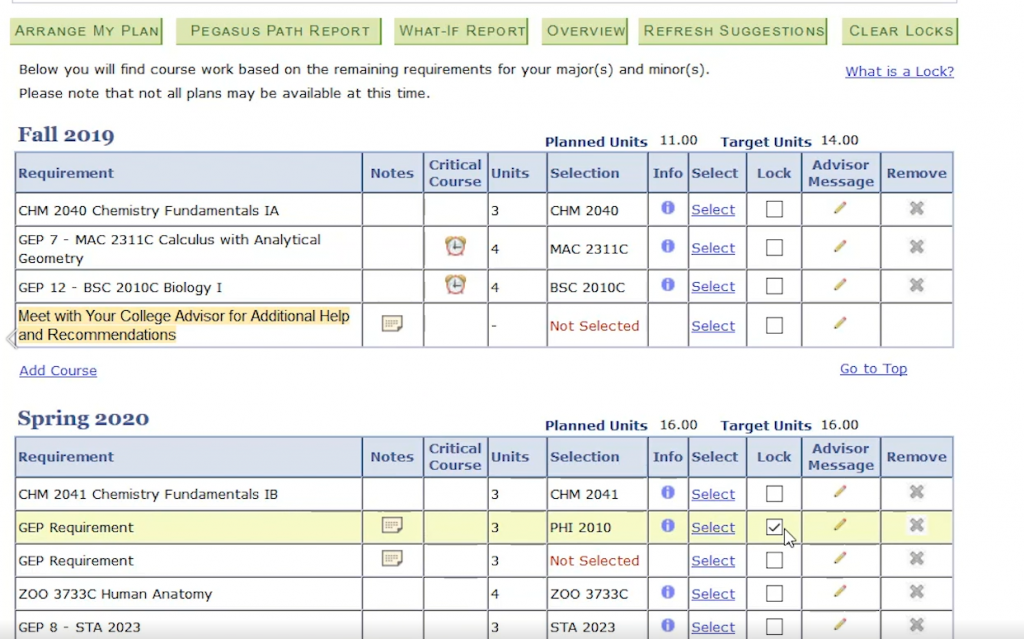
By checking the boxes in this column, you can lock certain courses or tasks into the semester, so they don’t get moved accidentally.
The Clear Locks option allows you to remove all locked courses, meaning you can move those courses again.
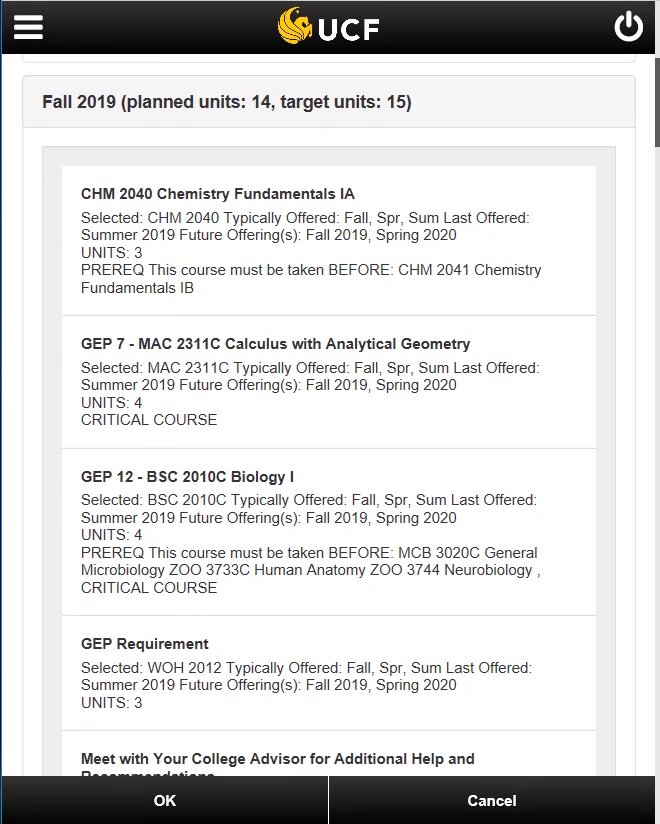
To access this report, navigate to the Preferences section and click on the Pegasus Path Report button located below it.
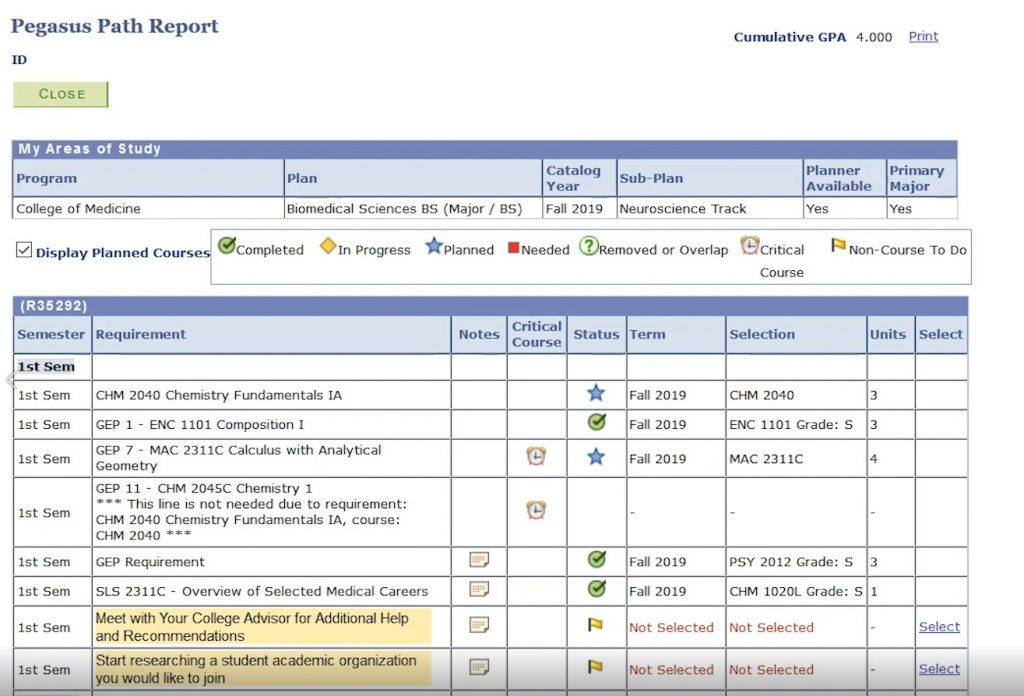
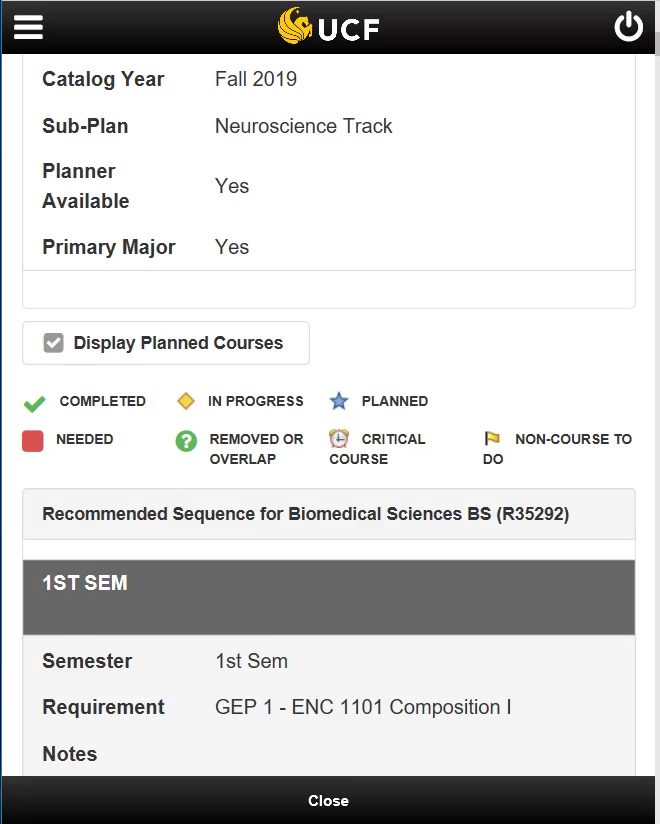
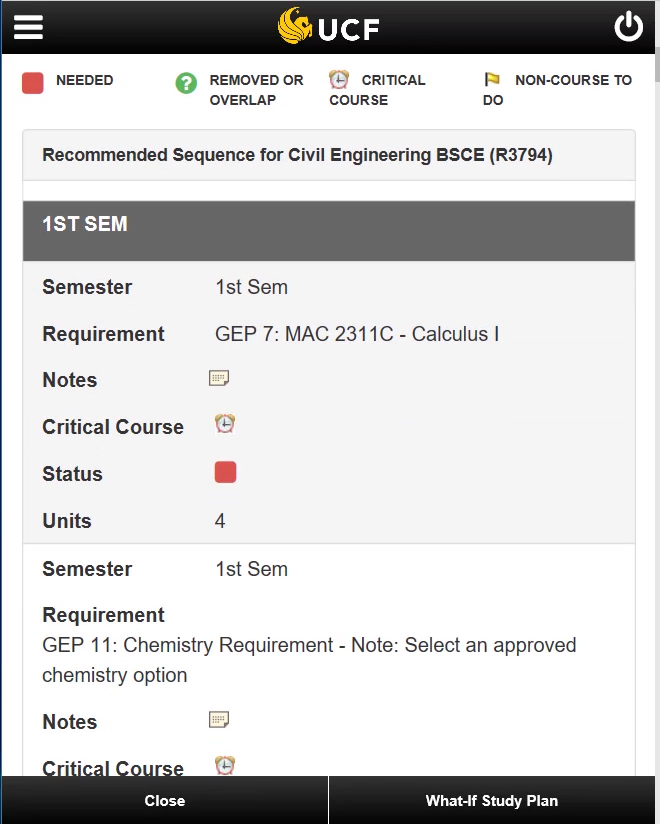
The Pegasus Path Report is a snapshot of your progress toward your degree. On this page you’ll be able to view:
- Semesters you’ve attended and/or semesters you plan to attend
- Completed, in progress and planned courses
- Courses that have been removed or overlap
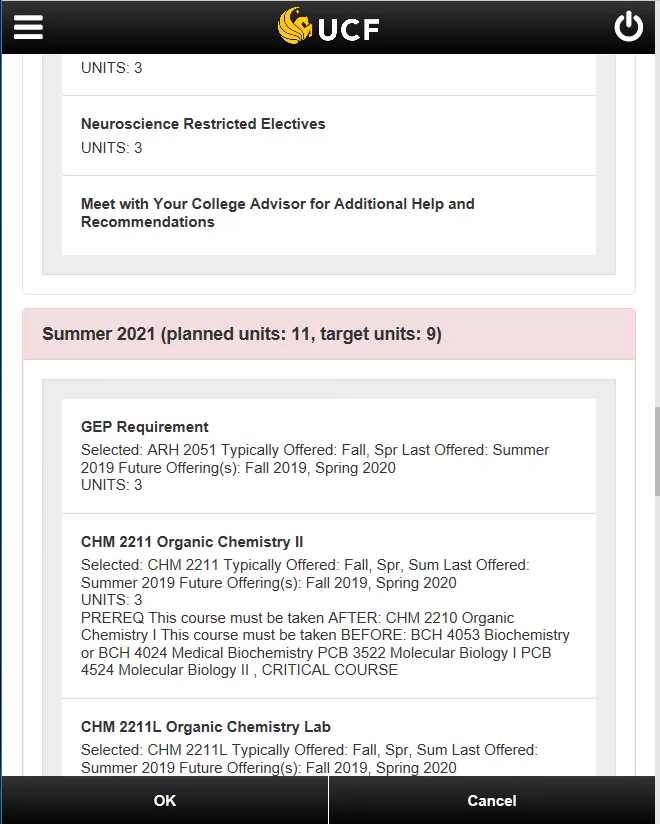
- Critical courses, or courses that are time-sensitive
- Non-course to-dos, or co-curricular activities
- e.g., Meeting with your advisor
Click Close in the top left corner of the page to view your dashboard.
When you’re back on the dashboard, click on the Pegasus Path Report button.
The Pegasus Path Report is a snapshot of your progress toward your degree. On this page you’ll be able to view:
- Semesters you’ve attended and/or semesters you plan to attend
- Completed, in progress and planned courses
- Courses that have been removed or overlap
- Critical courses, or courses that are time-sensitive
- Non-course to dos, or co-curricular activities
- Ex. Meeting with your advisor
Click Close at the bottom of the screen to return to the dashboard.
This feature shows you what your degree program might look like if you plan on changing or declaring a new major/minor/ in the future.
The What-If Report button is located directly underneath the Preferences section.
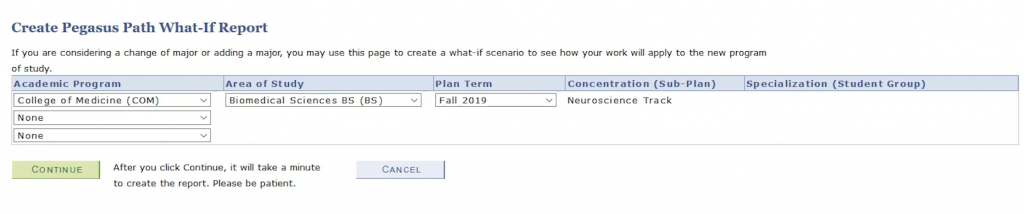
Let’s see what our plan would look like if we were to change our major to Economics.
1. First, select the college to which the new area of study belongs using the dropdown menu under Academic Program. Economics is part of the College of Business.
2. Next, select your major from the dropdown menu under Area of Study.
3. In the Plan Term column, choose the semester you plan to declare your new major/minor.
4. Click Continue to view your What-If Report.
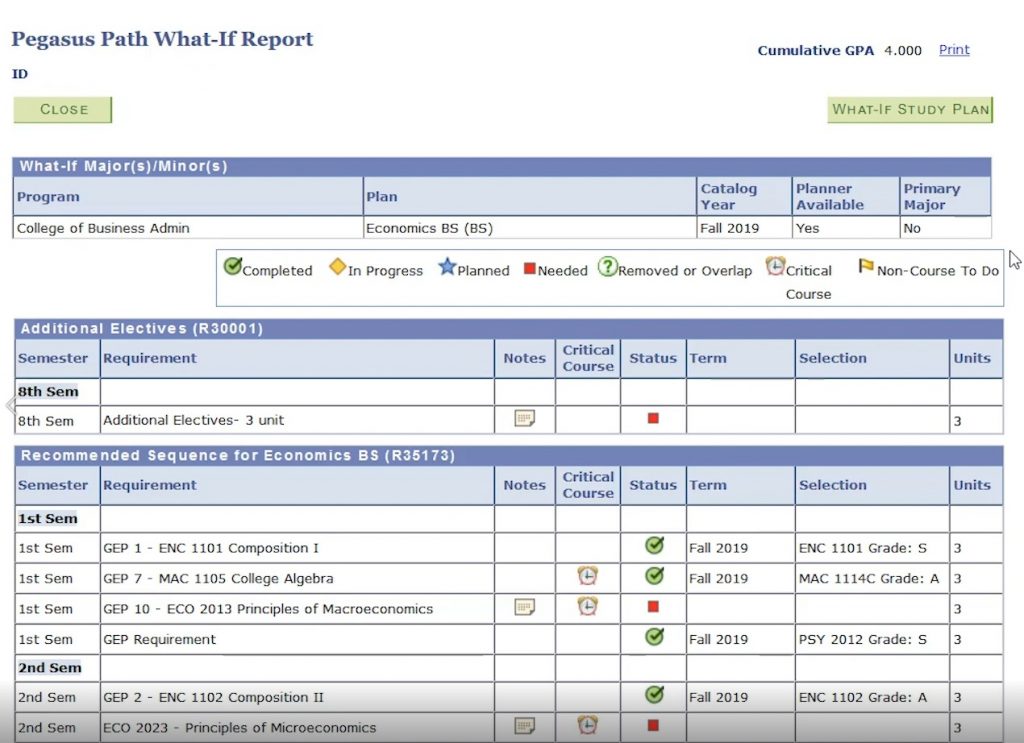
Now you’ll be able to see the recommended semester-by-semester sequence of courses if you were to change your degree program. The report will also show which courses you’ve already completed.
5. Click Close to return to the dashboard.
In this section, we’ll cover the What-If Report. This feature shows you what your degree program might look like if you plan on changing or declaring a new major/minor/ in the future. The What-If Report button is located under More > What-If Report.
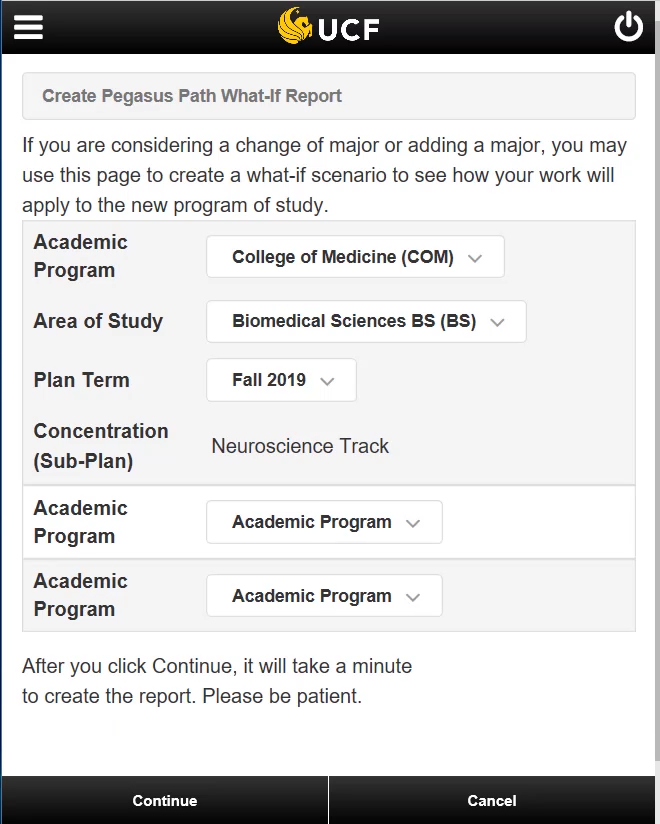
- To run a What-If Report, choose the college to which the major/minor belongs using the Academic Program dropdown menu
- Under Area of Study, choose your major or minor. We picked Civil Engineering.
- Select the semester you’re planning on changing your degree program under Plan Term.
- Click Continue at the bottom.
You can now look through your report, which shows how your current work would apply to your future program of study.
Clicking on What-if Study Plan brings up an example of how you could complete this major/minor.
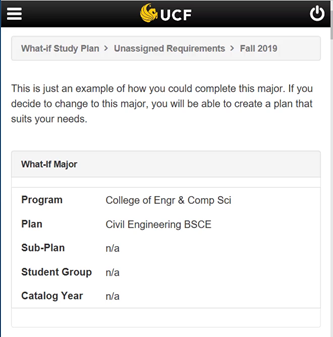
Scroll to the bottom to click Close and to return to the dashboard.
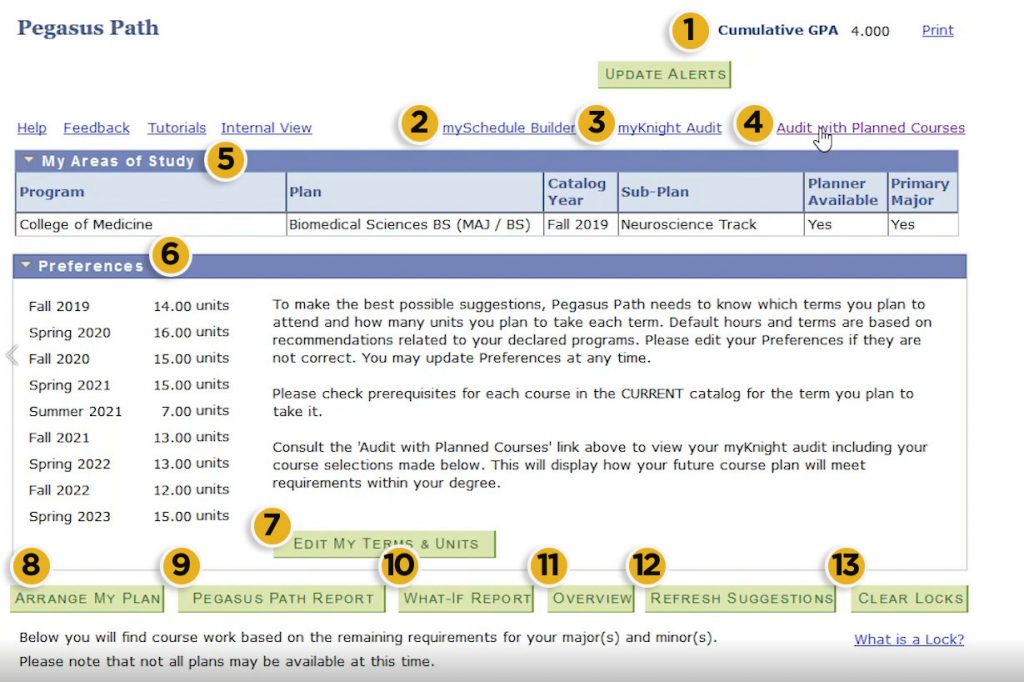
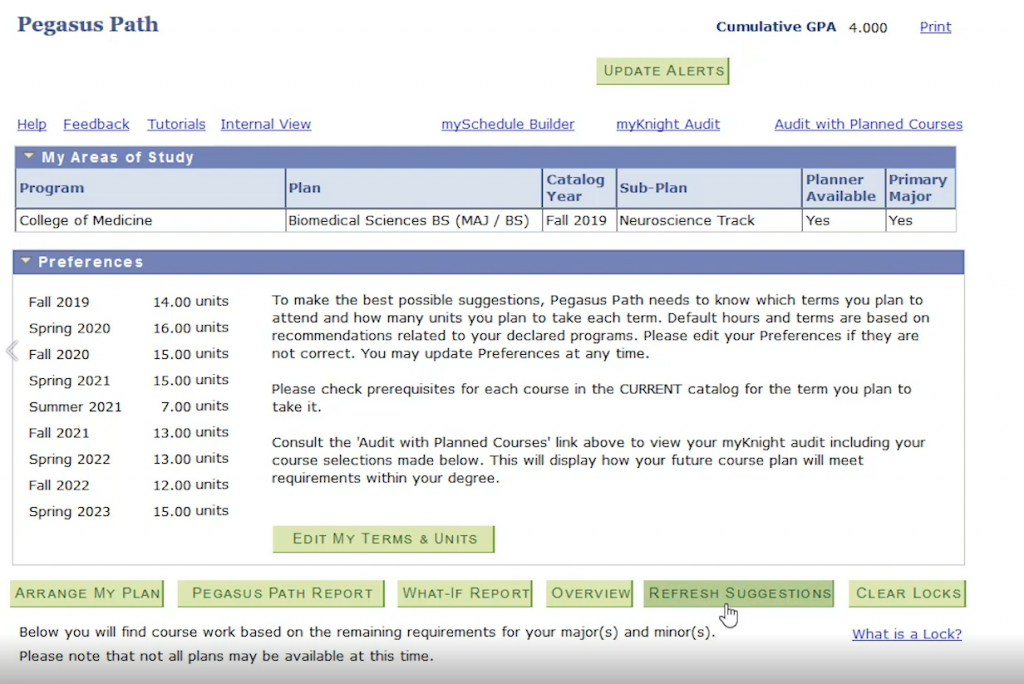
Once you’ve accessed the Pegasus Path, you’ll see important academic information at the top of the page:
- Cumulative GPA
- Link to mySchedule Builder
- Link to myKnight Audit
- Audit with Planned Courses
- My Areas of Study
- Preferences
- Edit My Terms & Units
- Arrange My Plan
- Pegasus Path Report
- What-If Report
- Overview
- Refresh Suggestions
- Clear Locks
Once you’ve accessed the Pegasus Path, you’ll see important academic information such as Cumulative GPA at the top of the page.
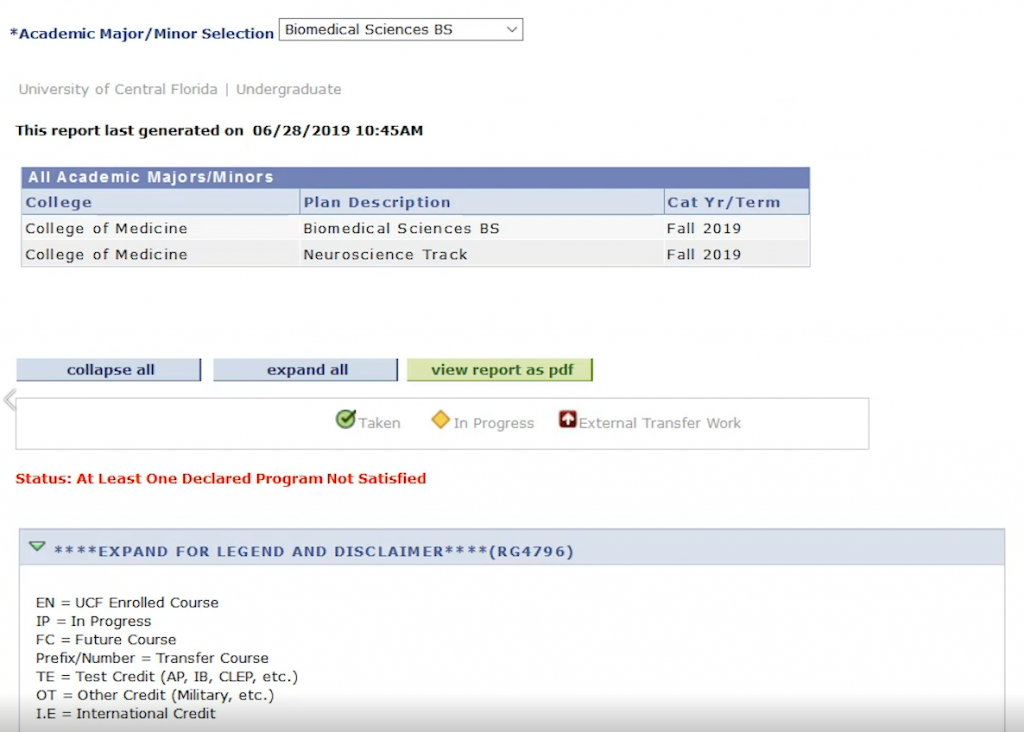
Below that, you’ll see My Areas of Study.
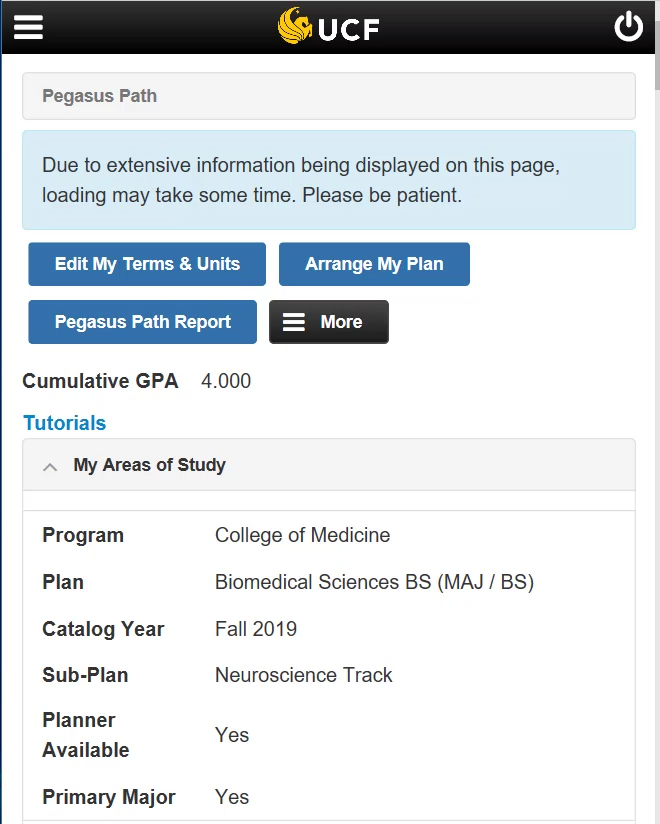
This section reflects your current majors/minors/certificates and catalog year (eg. If you started your Biomedical Sciences degree program in fall 2019, the information listed in Catalog Year column would reflect that).
Changing planned semesters and credit hours
- At the top of the dashboard, click on the Edit My Terms & Units button.
- To add a semester, simply click on the Add button. If you’re not planning on attending a certain semester, tap the delete button to remove that semester from your plan.
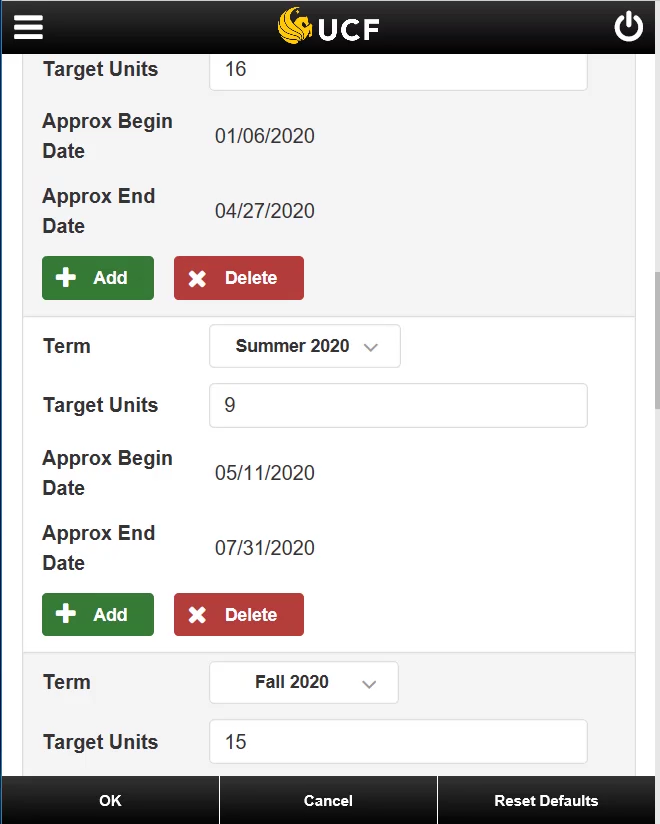
- Click OK to confirm deletion. Pegasus Path will automatically update your plan to reflect your changes
Below the Preferences section, you can see the academic plan that you have created for the rest of your time at UCF.
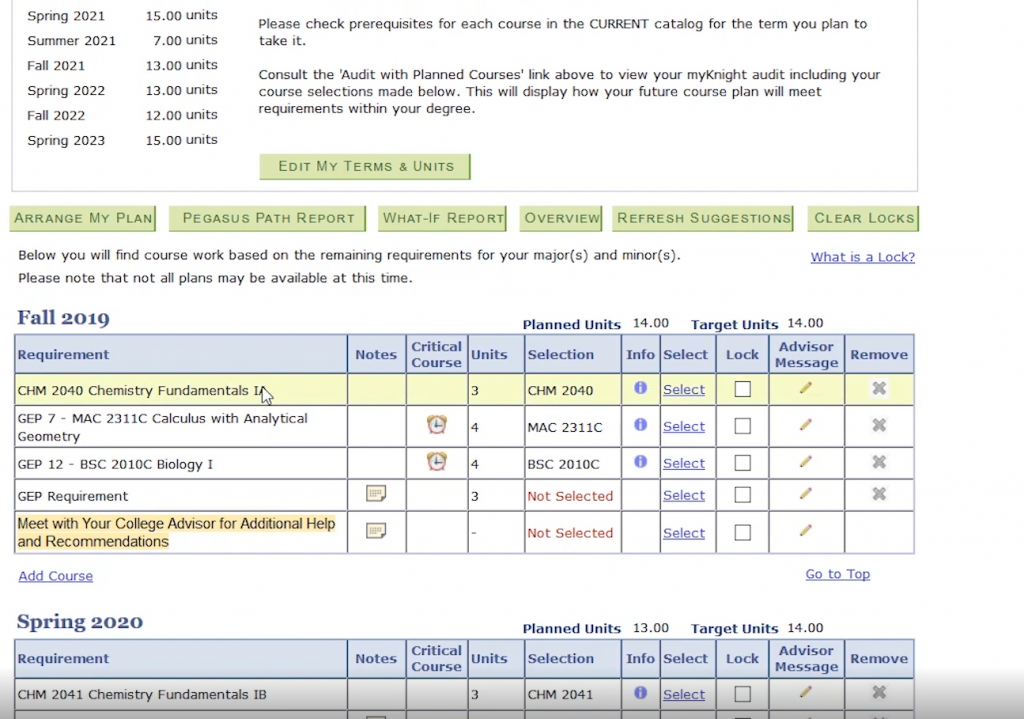
When you first log in to Pegasus Path, this section is automatically populated with the optimal degree plan for your program based on myKnight Audit. For example, if your area of study is Biomedical Sciences, you will see Chemistry Fundamentals in your first semester. This is required class for your area of study.
However, your plan is customizable, and you can make changes to your plan at any time. In the next section, we’ll show you how to select classes you’d like to add to your plan.